.png)
“We need better forecasts.”
We hear this often — usually after:
- a painful stockout
- a surge in working capital
- or a board meeting where service levels and margins are being questioned
The natural reflex is to improve forecast accuracy: new models, new AI, more features.
But forecast error is rarely the real problem. The real problem is its financial impact.
So before investing in another forecasting engine, there is a more important question to ask:
What business decision are we actually trying to improve?
Even the most advanced AI model — trained on excellent data and enriched with promotions, weather, price elasticity and external signals — will sometimes be wrong.
Demand and supply are uncertain by nature.
The real question is not:
“How do we eliminate forecast error?”
It is:
“What level of forecast quality do we need to achieve our financial objectives?”
That question changes the discussion completely.
In this article, we will walk through the key questions worth asking and illustrate them with a concrete use case from our experience: automated inventory replenishment.
From forecast accuracy to business impact
What decision is the forecast supporting?
A forecast is not an end in itself. It supports a decision.
Most forecasting use cases fall into two broad categories:
A. Strategic forecasting
Budgeting, S&OP, investment decisions and capacity planning.
These decisions usually require aggregated data and a medium- or long-term horizon. The overall direction matters more than SKU-level detail.
B. Operational forecasting
Short-term resource allocation, replenishment, production planning and workforce scheduling.
These decisions usually operate at SKU level and on shorter horizons, where detail matters directly for execution.
The two use cases require different models, different metrics and different expectations.
Yet many organizations still try to solve both with one supposedly “better forecast.”
At what level and horizon should accuracy be measured?
Forecasting 10,000 SKUs individually is very different from forecasting total company demand.
Achieving less than 10% MAPE (mean absolute percentage error) at an aggregate level is common.
Forecasting a single SKU with volatile demand is much harder. If actual demand is 1 and the forecast is 2, MAPE is 100%.
Is that catastrophic?
Statistically, yes.
Financially? Maybe negligible, maybe not. Are you selling jewelry or toothpicks?
This is where technical accuracy metrics can become disconnected from business reality.
The decision horizon matters just as much:
- A model optimized for daily SKU-level forecasts may perform poorly for monthly forecasts at product-family level.
- Advanced machine-learning models can incorporate promotions, prices, weather, customer backlog and other drivers, and may perform very well in the short term. But can you reliably tell the model what the weather, price or promotional plan will be three or six months from now?
You may need several models — or you may need to accept explicit trade-offs.
One universal model rarely optimizes every business objective at once.
One number or a range?
Many organizations still work with a single forecast value, largely because that is how forecasting systems historically presented the answer.
But decisions are made under uncertainty.
Today, probabilistic forecasting can provide:
- a median forecast
- confidence intervals
- full demand distributions
When planning capacity or inventory, what matters is not only the most likely outcome, but also:
- the probability of being wrong
- the cost of being wrong
A most-likely forecast of 1 million units may fit comfortably within planned capacity of 1.2 million. But what if there is a 30% probability that demand will reach 1.5 million? That leads to a very different decision.
Which brings us to the next question.
What are the consequences of being wrong?
.png)
A luxury brand may tolerate stockouts — in some cases scarcity can even reinforce demand.
A Tier-1 automotive supplier cannot.
The same forecast error can therefore have radically different financial consequences.
Most decisions based on forecasts involve a balance between:
- shortage risk
- cost of excess inventory
- availability of contingency plans
- operational constraints
- cash availability
This may sound complex, but these trade-offs already exist in every organization.
The real question is whether they are managed consciously and parameterized, or left as implicit assumptions inside thousands of daily decisions without a clear view of their financial consequences.
With an integrated decision system such as Nadii, defining these parameters usually takes only a few hours and ensures that operational decisions account for the wider business impact.
When someone says:
“Our forecasts are wrong.”
The more useful question is:
“Wrong relative to what financial impact?”
Concrete example: replenishment
Consider the most common operational use case: inventory replenishment.
First, if you forecast demand but ignore supply variability, you are optimizing only half of the system.
Even an excellent demand forecast will not protect you from:
- customs delays
- geopolitical disruption
- supplier issues
- extreme weather events
But let us focus on demand forecasting for the moment.
Consider a fast-moving overseas product with a long lead time — for example, one that requires roughly four months of coverage until the next replenishment opportunity.
Is a 30% forecast deviation over that horizon catastrophic?
Often, it is not.
Why?
Because inventory buffers already exist to absorb uncertainty. They may be sophisticated or very simple, but planners naturally introduce buffers when placing orders.
A forecast deviation of ±30% may therefore create little or no incremental cost.
An 80% underestimation, however, may lead to:
- weeks of stockouts
- lost margin
- expedited freight
- an operational crisis
- long-term customer damage
An 80% overestimation may be manageable for a fast mover, but disastrous for a seasonal or high-value product.
The impact is asymmetric and product-specific.
That asymmetry is not captured well by aggregated metrics such as MAPE or RMSE.
So how do you determine whether your forecasts are good enough?
Portfolio-level accuracy can hide the reality. Large errors on a small number of critical SKUs may drive most of the financial pain.
Forecast metrics measure deviation. They do not measure consequence.
Forecasting should therefore be assessed in the context of the overall business decision.
.png)
Forecast error is only one potential cause of financial underperformance among many:
- supplier unreliability
- MOQ constraints
- purchasing incentives
- manual overrides
- shelf or presentation-stock requirements
Optimizing forecast accuracy in isolation often means optimizing locally — not globally.
The real shift: from forecast optimization to decision optimization
Once forecast error is treated as one possible cause of underperformance rather than the objective itself, you can ask a better question:
“What is the financial cost of each type of error — and how do we optimize decisions under uncertainty?”
That requires quantifying:
- lost margin
- the cost of excess inventory
- capital tied up in stock
- operational impact
If you use an integrated replenishment system such as Nadii, the required data is already available within the decision process.
Only then can you determine:
- which SKUs or product groups truly require greater forecast precision
- the ROI of investing in a new forecasting model, based on what forecast errors actually cost
- where supply variability is the real problem
- where shortening lead time creates more value than improving forecast accuracy
You can then investigate the right causes. Nadii, for example, reports the cost of different causes and how those costs evolve over time. In the illustration below, OS represents overstock and LM represents lost margin.
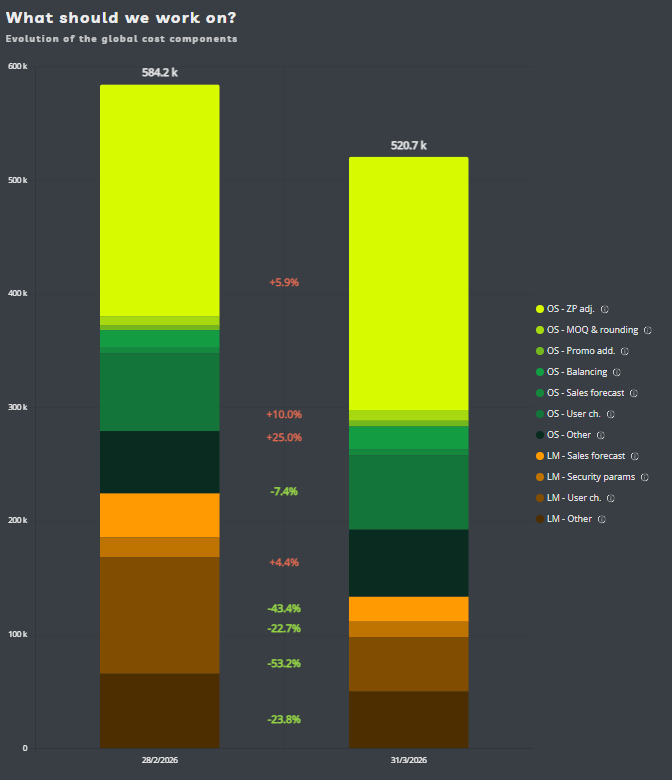
For example:
“Last week or month, stockouts cost us X euros and the cost is increasing. Forty percent came from supplier issues and only 5% from forecast inaccuracy.” In that situation, supplier performance deserves attention first.
Or: “Last week or month, excess inventory cost us X euros. Fifty percent came from user-defined constraints and 5% from forecast inaccuracy. For product group X, however, forecast error is the main driver and its impact is increasing.” That is where forecast improvement should be investigated.
The forecast becomes one input. The objective becomes profit under uncertainty.
What does this mean in practice?
To operate this way, you need more than a forecasting engine.
You need a decision system that:
- integrates demand and supply uncertainty
- translates probabilities into financial consequences
- evaluates trade-offs SKU by SKU
- links daily microdecisions to P&L and cash flow
This is the logic behind Nadii.
Instead of optimizing forecasts in isolation, Nadii evaluates the total cost of each replenishment decision:
- shortage risk versus the cost of excess
- impact on margin
- impact on working capital
- operational constraints
The system does not try to eliminate uncertainty — it manages it.
That changes the discussion from:
“Are our forecasts accurate enough?”
to:
“What should we improve first to make our decisions financially optimal under uncertainty?”
Conclusion
Better forecasts can help.
But only when they are embedded in a system that understands:
- the consequences of errors
- the asymmetry of those consequences
- risk
- cash
- operational constraints
Before investing in another forecasting engine, it is worth asking:
Are we trying to improve a metric?
Or are we trying to improve the financial outcome of our decisions?
.png)