
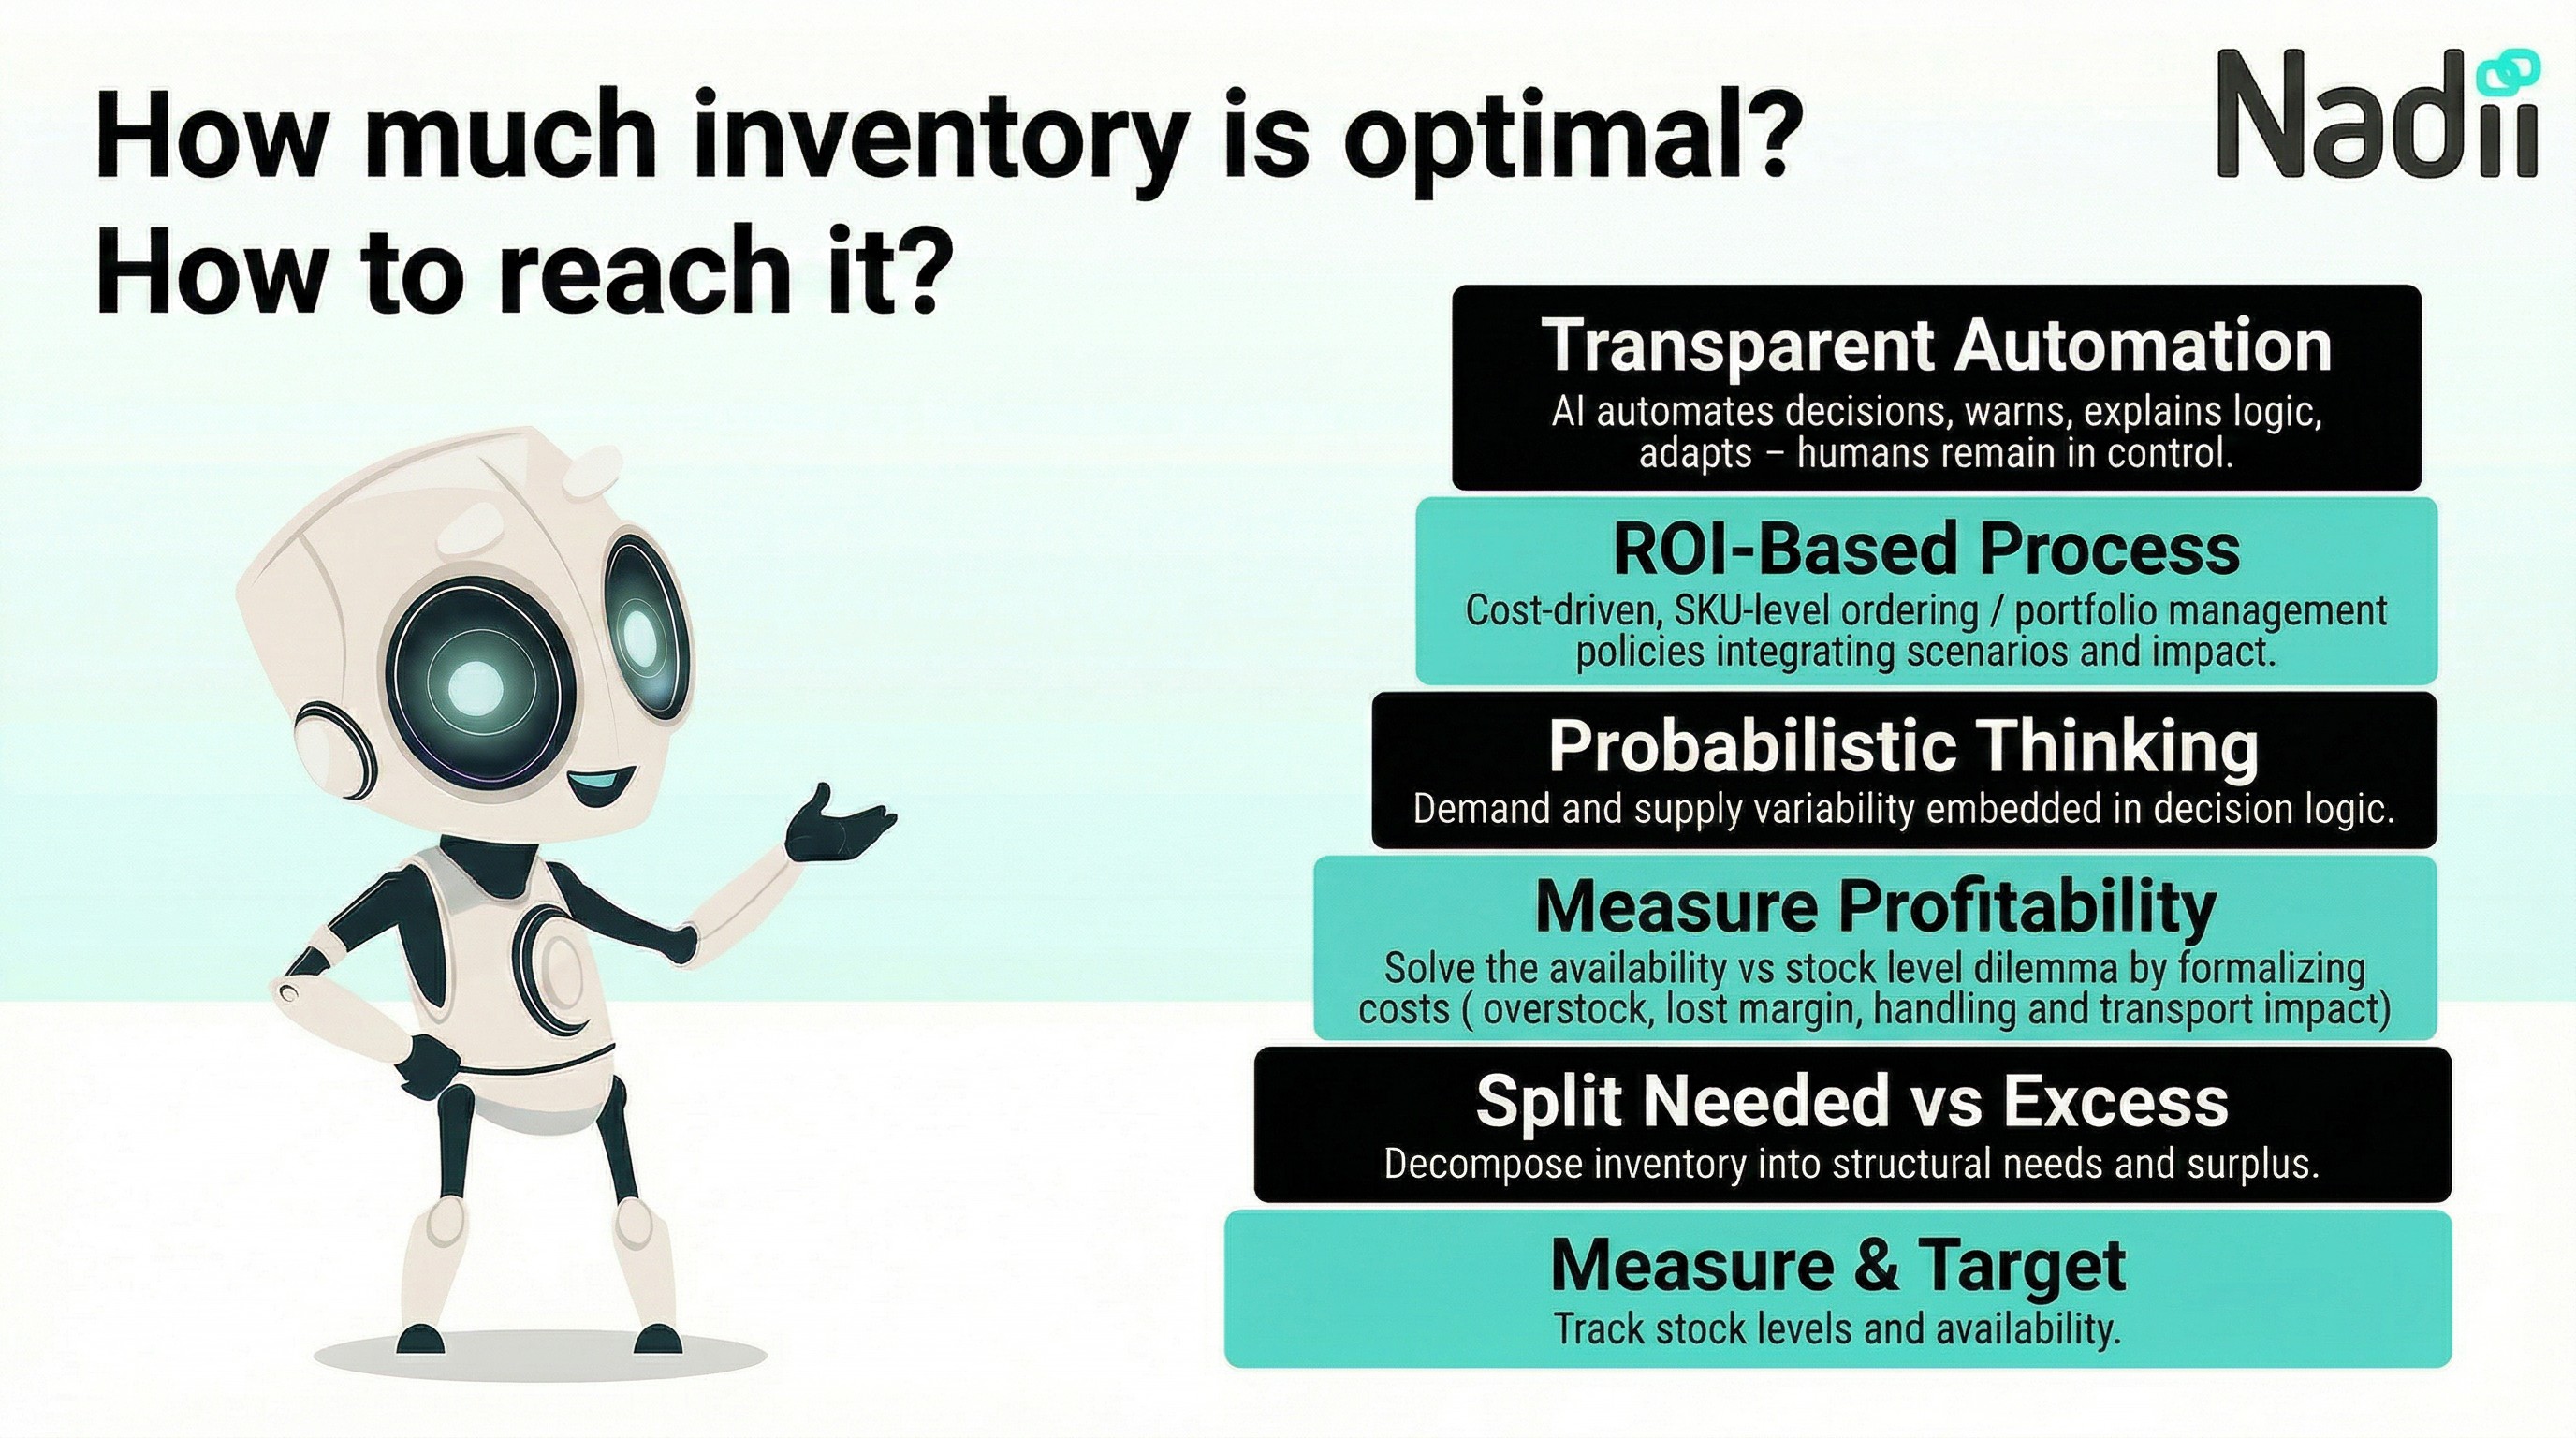
Have you ever asked yourself:
“What is the optimal inventory level for my company?”
If so, have you ever received a clear and convincing answer? Most managers have not.
If key pieces of the answer are still missing, this article will help explain:
- why this question matters far more to the business than many organizations assume
- why it is so difficult to answer properly
- and which practical steps can help you get much closer to the right answer
If, like many companies, you set inventory targets by comparing yourself with competitors or with last year's results, you usually get an illusion of control rather than a real answer.
As H.L. Mencken famously put it:
“For every complex problem, there is an answer that is clear, simple... and wrong.”
Inventory optimization is exactly that kind of problem.
Why does this question matter to your business?
Getting the answer right takes some work.
But the more important question is:
Can you afford not to answer it?
If the optimal inventory level is not defined from the perspective of the whole company, decisions will still be made — just implicitly.
Each department will naturally optimize for its own objectives:
- sales will push for maximum availability
- purchasing will pursue volume discounts
- logistics will favor operational stability and lower handling costs
- finance will seek to reduce cash tied up in stock
None of these objectives is wrong in itself.
But without a common decision framework, they often work against one another and reduce the company's total economic performance.
When a crisis hits, cash efficiency can become a matter of survival
When the market contracts or a crisis arrives, disciplined cash management quickly becomes a top priority.
In competitive sectors such as distribution, retail and manufacturing, inventory is often one of the largest uses of working capital.
The ability to control inventory precisely can make the difference between:
- navigating a downturn in a controlled way
- and making abrupt purchasing cuts that destabilize operations
Unfortunately, many companies recognize this only after the crisis has already begun.
Several of our customers came to us at exactly that point — when better inventory decisions suddenly became essential to preserving cash and business continuity.
When supply becomes less predictable, availability becomes a competitive weapon
For some products, availability alone can be a competitive advantage.
If your competitor cannot deliver and you can, the result may be:
- additional sales
- stronger customer loyalty
- higher margins
But maintaining that advantage requires understanding how much inventory is actually needed to protect availability when the supply chain itself is unstable.
Very few companies incorporate this explicitly into their inventory strategy.
By accounting natively for supply variability, systems such as Nadii can reduce total inventory while maintaining higher availability for sensitive products at critical times of the year. Some of our distribution customers have even experienced the rather satisfying situation of competitors calling to ask whether they could buy part of their stock to save the season.
The hidden cost of suboptimal decisions
From our experience across multiple companies, for every EUR 1 million held in inventory, organizations can leave roughly EUR 50,000 to EUR 100,000 of recurring annual profit on the table.
It is fair to say that this number is itself a simplified answer to a complex problem. That is why we prefer to calculate the economics for each specific situation. But this is the range we have repeatedly observed in our work with customers.
The lost potential usually comes from a combination of:
- excess inventory
- lost margin caused by stockouts
- operational inefficiencies
Another hidden cost of suboptimal inventory management is the conflict it creates between departments.
Once the company defines a clear method for determining the optimal level — including the factors that genuinely matter — discussions become much easier:
The objective becomes the performance of the whole company, not the KPI of one department.
Why is the answer so difficult?
The difficulty starts with one simple fact:
Inventory is not one decision. It is the result of thousands of microdecisions.
Inventory is fundamentally a product × location × time problem.
Every euro invested in inventory has a different value, and every product behaves differently.
Imagine the following situation:
You hold EUR 10 million of inventory.
But:
- EUR 8 million is tied up in slow-moving items
- EUR 2 million covers bestsellers that are constantly selling out
Technically, you may be exactly “on target” for total inventory value.
Operationally, the situation can still be disastrous.
This is why the optimal-inventory question must be answered:
- for each product
- for each location
- and continuously over time
because optimal inventory is inherently dynamic. Changes should of course be communicated in advance to warehouse teams so they can adapt layout and workload — but that is a separate operational question.
The company's optimal inventory level is therefore simply:
the sum of the optimal inventory levels for every product in every location.
Many parameters influence the answer
The complexity also comes from the number of factors that must be considered:
- supplier constraints
- MOQ and lot sizes
- smart-buying opportunities, incentives and cashback
- seasonality
- supplier reliability
- demand variability
- minimum shelf exposure
- legal or contractual penalties for stockouts
- warehouse capacity and operational workload
- transport costs
- the financial cost of capital
At first glance, this can look overwhelming.
In practice, however, most of this information already exists somewhere inside the company.
The real problem is usually that the relevant parameters are not available in a structured form to the people making daily decisions.
How can you approach optimal inventory? Start with simple methods
Before calculating an optimal inventory level, it is worth asking one very simple question:
Why does this inventory exist at all?
One of the most useful methods is to segment inventory according to the reason it is being held.
This logic appears in several modern supply-chain approaches, including DDMRP.
Step 1 — Do we need inventory in this location at all?
It may sound obvious, but at scale it is not.
For every product and every location, ask:
- What lead time is acceptable to the customer?
- What is my economically justified replenishment lead time?
- What is the contingency plan if something goes wrong?
If the lead time acceptable to the customer is longer than the replenishment lead time, and a credible contingency plan exists, local inventory may not be necessary at all.
In some situations, zero stock is genuinely the optimal answer.
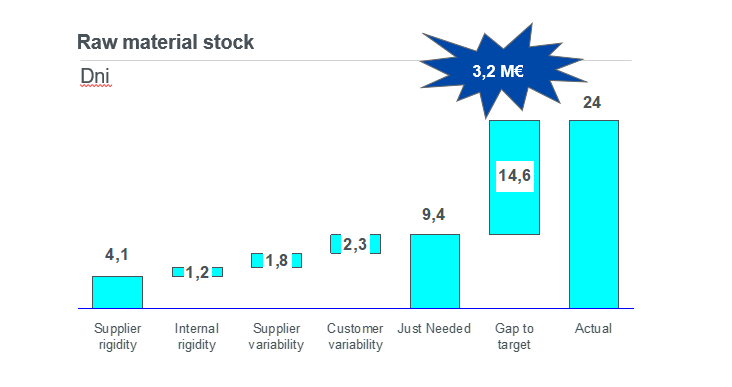
Step 2 — Segment inventory by its drivers
The basic idea is to answer “Why are we holding this stock?” by breaking the answer into specific causes.
DDMRP uses a related logic and correctly emphasizes lead time. It also recognizes that real-world demand and supply vary — something many simpler methods ignore — although it still handles that variability in a simplified way.
A useful decomposition can look like this:
Supplier rigidity
Inventory required between supplier deliveries or created by MOQ and ordering constraints. This amount naturally changes depending on where you are in the replenishment cycle.
Supplier variability
Additional inventory held to protect against uncertain supply: delays, quality problems, shortages or inconsistent delivery performance.
Customer / demand variability
A buffer covering the difference between expected and actual demand. This is often the hardest element to estimate. But even asking, “How much variability should I expect for this product, and how much uncertainty am I willing to cover?” is already a major improvement over ignoring the question.
Customer rigidity
Inventory required because customers collect or receive goods periodically. This is common in some manufacturing supply chains and close to zero in many other environments.
Internal constraints
Inventory created by handling delays, batch production, quality checks or other internal process constraints.
Smart buying / financial incentives
Additional inventory purchased deliberately because the financial benefit of a discount or incentive exceeds the cost of holding the stock.
Applying this logic product by product gives a first approximation of the inventory level that is actually justified.
Step 3 — Identify excess inventory
Once inventory has been segmented by its drivers, it becomes much easier to compare:
actual inventory vs. justified inventory
Anything above the justified level becomes a candidate for excess stock.
Some of Nadii's founders used this approach earlier in their careers as operational supply-chain managers, performing the analysis in Excel.
Even with relatively simple tools, the effect was striking.
Simply making planners aware of this logic helped teams:
- reduce inventory
- maintain availability
- align decisions across departments
But the limitations of a manual approach appeared quickly.
The limitations of simple approaches
Methods such as segmentation and basic safety-stock formulas provide useful transparency.
But they usually encounter three major limitations.
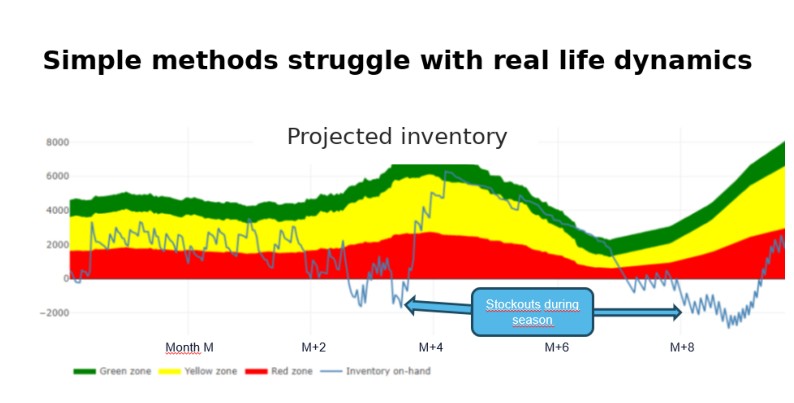
Static models versus a dynamic reality
Demand and supply change continuously.
No team has the time to update thousands of spreadsheet parameters throughout the year.
Seasonality, promotions, supplier performance and market changes quickly make static buffers obsolete.
The result is predictable:
- excess stock outside the peak season
- shortages during the peak season or promotional periods
— exactly when these mistakes hurt the business most.
Even widely used approaches such as DDMRP either omit part of this dynamic or address it with simplified parameters. A buffer that does not evolve with the real variability of demand, supply and financial consequences will eventually become wrong.
The only robust answer is to update buffer logic dynamically. At meaningful scale, doing that manually is simply not realistic.
The problem of scale
Spreadsheet-based approaches become difficult to maintain very quickly when a company manages:
- more than 500 SKUs
- multiple warehouses
- complex lead times
- promotional campaigns
- changing supplier reliability
At that point, maintaining the model can become harder than using it.
The missing financial perspective
Most companies manage inventory through operational KPIs such as:
- service level
- inventory value
- inventory turns
But the true objective is economic performance.
Every additional percentage point of availability has a cost.
Every stockout has a cost.
The problem is that nobody can say whether 97% availability is better than 95% or 99% without understanding how much inventory and operational cost is required to achieve each level.
How to achieve optimal inventory — for real
Step 4 — Put profitability into the equation
Consider two situations.
Suppose you have EUR 1,000 of “excess” inventory.
Is it the same problem if the product is:
- a slow mover with a short shelf life, where EUR 1,000 represents six months of sales?
- or a fast-moving flagship product, where EUR 1,000 represents one day of sales?
Clearly not.
Now imagine you are missing EUR 100 of inventory.
Is the impact the same if the product is:
- easy to substitute
- or critical to the customer?
Again, the answer is no.
This leads to an important conclusion:
Inventory level itself is not the right KPI. The right KPI is the economic outcome.
To measure that properly, companies need to estimate:
- the cost of excess inventory
- lost margin caused by stockouts
- operational costs
- the financial cost of capital
Once these trade-offs become explicit, inventory stops being only an operational KPI and becomes a financial lever.
At Nadii, we calculate these costs continuously so companies can:
- automate inventory and portfolio decisions based on the expected cost of different scenarios under uncertainty
- see what excess inventory actually costs
- see what shortages actually cost
This transparency improves both automated decisions and human decisions.

Step 5 — Move from forecasts to probabilistic decisions
Most inventory-management systems still rely on a single forecast.
But in real life, decisions are rarely based on a single possible future.
When we make everyday decisions, we intuitively consider:
- the best-case scenario
- the worst-case scenario
- the probability of different outcomes
Inventory decisions should follow the same logic.
The real question becomes:
What is the ROI of the next euro invested in inventory, given the uncertainty of both demand and supply?
Instead of considering one forecast, we should consider:
- multiple demand scenarios
- multiple supply scenarios
- their probabilities
- their financial consequences
When decisions become probabilistic and cost-based, the supply chain stops merely reacting to events and starts preparing for them.
Step 6 — At scale, automation becomes necessary
Once a company reaches a certain scale — typically more than a few hundred SKUs — the number of relevant parameters becomes too large to manage manually.
This is even more true if the objective is not merely to calculate an inventory target once, but to maintain an economically optimal level continuously as demand, supply, costs and constraints change.
That is when automation becomes essential.
Not as a mysterious black box, but as a transparent decision system.
A good system should:
- automate routine decisions
- explain its logic
- learn and adapt from outcomes
- highlight exceptions instead of flooding users with reports
- leave people in control of strategy
Supply chains are inherently messy. Unexpected situations happen all the time.
The purpose of technology is not to eliminate complexity.
Its purpose is to manage complexity intelligently.

.png)